Better Analytics for Your Shared PDFs
SharePDF now shows you exactly how people interact with your shared PDFs - views over time, where viewers are, and how they found your PDF.
When you share a PDF, the question that follows is always the same: did anyone actually look at it?
Until now, SharePDF showed you a view count - a single number telling you how many times your document was opened. Useful, but not the full picture. Today, we're rolling out a much better analytics dashboard that tells you a lot more about how people interact with your shared PDFs.
We're now using Cloudflare's Workers Analytics Engine for the analytics so the data you see is not just rich but also fairly accurate.
What you can see now
Views over time
Instead of just a total number, you now get a chart showing views per day. You can see whether your document got a burst of attention on one day or steady traffic over weeks. Pick a time range - the last 7 days, 30 days, or 90 days - to zoom in on the period that matters to you.
Where your readers are
SharePDF now shows you the top countries your viewers are in. If you shared a proposal with a client in India and you see views from India, you know they opened it. If you posted a report publicly and see views from 15 different countries, you know it's reaching a wider audience than you expected.
How people found your document
The referrers section shows you where your traffic is coming from. Did someone click the link from LinkedIn? From an email? From a website that linked to your PDF? Now you can see that, which helps you understand which channels are actually driving people to your documents.
Unique visitors
View counts can be misleading - one person refreshing the page shows up as multiple views. The new dashboard separates total views from unique visitors, so you know how many individual people actually looked at your document.
Top PDFs at a glance
If you've shared multiple documents, you can see which ones are getting the most attention. A simple bar chart ranks your PDFs by views, so you can quickly spot which documents are resonating.
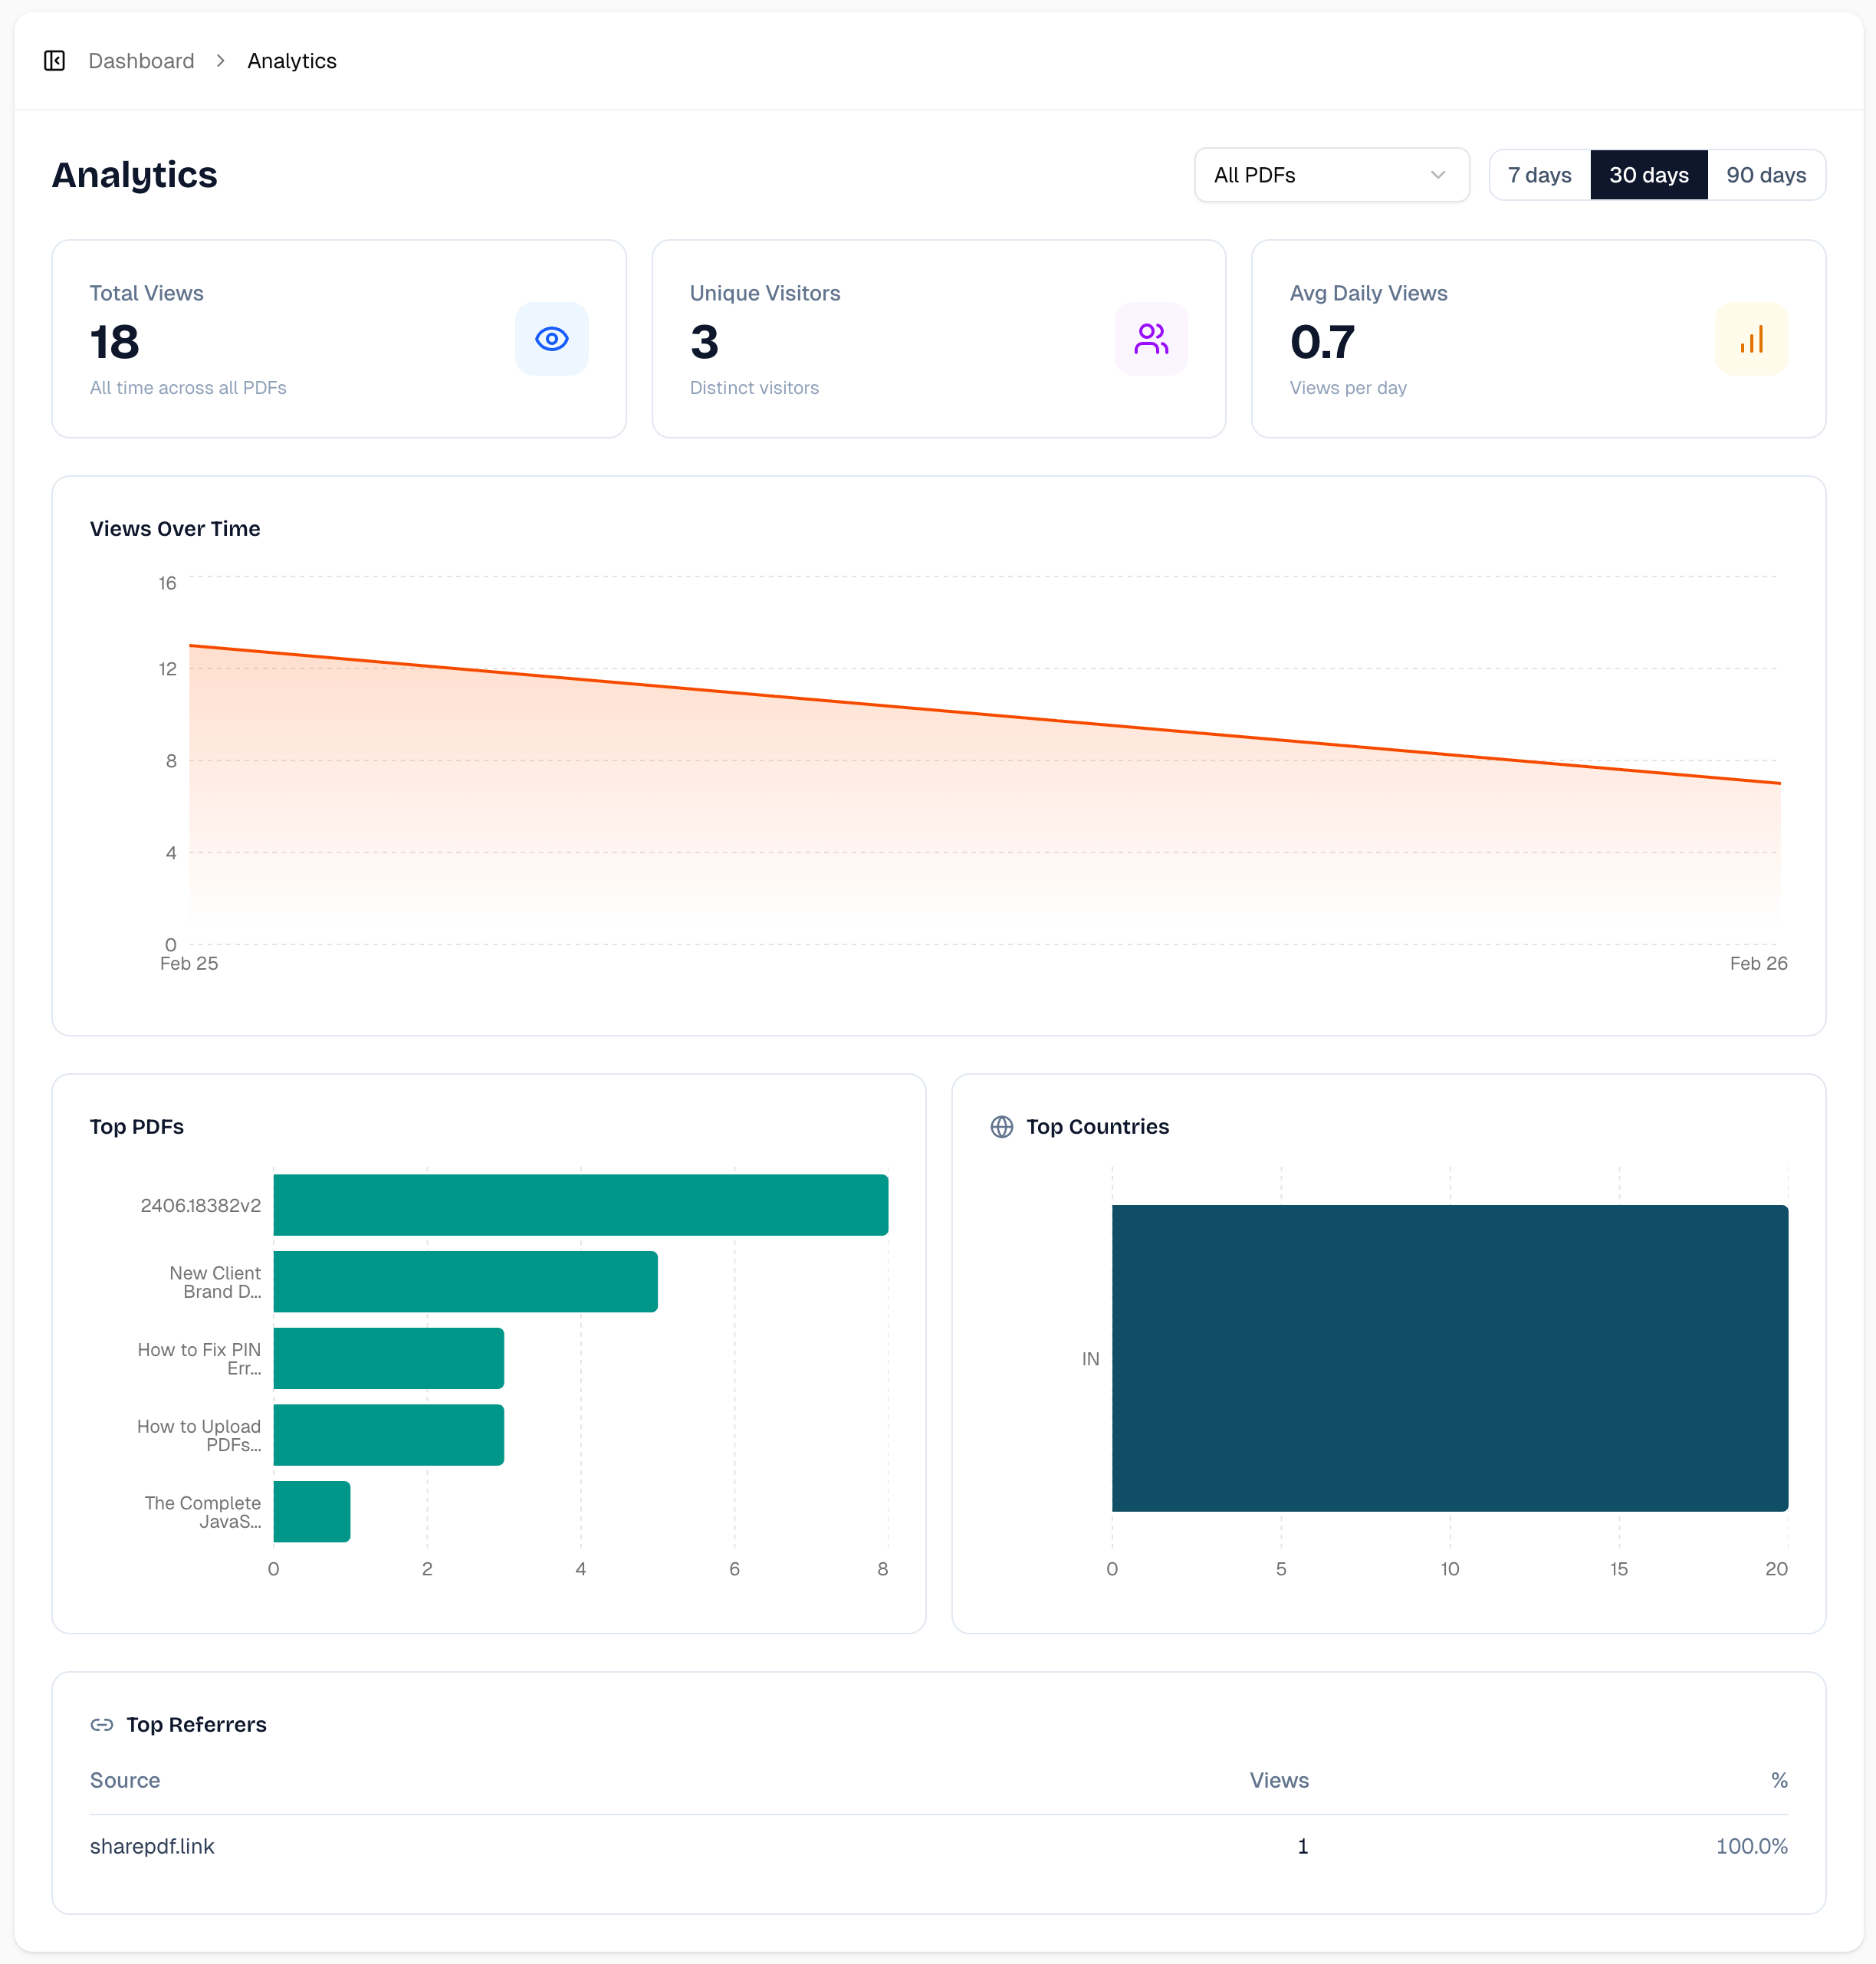
Filter by document
Have 10 PDFs shared but only care about one? Use the dropdown to filter analytics to a specific document. Or view everything together for a bird's-eye view of all your shared PDFs.
Available on Pro and Max plans
The new analytics dashboard is available on Pro and Max plans. Free accounts still show total views for each PDF - which is plenty if you just need to confirm someone opened your document. But if you want the full picture - trends, geography, referrers, unique visitors - upgrading gets you there.
Why this matters
Sharing a PDF shouldn't feel like throwing it into a void. Whether you're sending a sales proposal and need to know the client opened it, distributing a report and want to see which teams are reading it, or sharing your portfolio and wondering if anyone's looking - better analytics close that gap.
You share a document. Now you know what happens next.
The new analytics dashboard is live now. Log in to your account and check it out, or sign up free to get started.